To avoid grainy graphics and the wrong size/type of fonts in publications and presentations, inkscape has a wonderful option, created by Johan Engelen, that splits a figure into the drawing alone and a small latex file that calls the drawing and places all fonts. When you now embed the latex file in your presentation or your publication, the latex style file will determine the size and type of the font used. The result is a perfectly embedded figure in the style of your document! Below are the steps to Nerd Nirvana:
Draw your figure
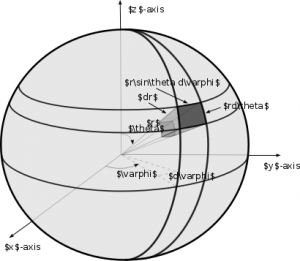
Let’s draw a figure. Here is a figure in svg-format, made in inkscape:
Note that we use latex math commands here, which makes this figure looks a bit messy, at first. When we are done drawing, we save as a pdf, and choose the option: “pdf+latex.” The font-free pdf file is spherefigc2.pdf, and the latex file that places the fonts in it, is
%% Creator: Inkscape inkscape 0.48.5, www.inkscape.org
%% PDF/EPS/PS + LaTeX output extension by Johan Engelen, 2010
%% Accompanies image file 'spherefig2c.pdf' (pdf, eps, ps)
%%
%% To include the image in your LaTeX document, write
%%   input{<filename>.pdf_tex}
%%  instead of
%%   includegraphics{<filename>.pdf}
%% To scale the image, write
%%   defsvgwidth{<desired width>}
%%   input{<filename>.pdf_tex}
%%  instead of
%%   includegraphics[width=<desired width>]{<filename>.pdf}
%%
%% Images with a different path to the parent latex file can
%% be accessed with the `import' package (which may need to be
%% installed) using
%%   usepackage{import}
%% in the preamble, and then including the image with
%%   import{<path to file>}{<filename>.pdf_tex}
%% Alternatively, one can specify
%%   graphicspath{{<path to file>/}}
%%
%% For more information, please see info/svg-inkscape on CTAN:
%%   http://tug.ctan.org/tex-archive/info/svg-inkscape
%%
begingroup%
  makeatletter%
  providecommandcolor[2][]{%
    errmessage{(Inkscape) Color is used for the text in Inkscape, but the package 'color.sty' is not loaded}%
    renewcommandcolor[2][]{}%
  }%
  providecommandtransparent[1]{%
    errmessage{(Inkscape) Transparency is used (non-zero) for the text in Inkscape, but the package 'transparent.sty' is not loaded}%
    renewcommandtransparent[1]{}%
  }%
  providecommandrotatebox[2]{#2}%
  ifxsvgwidthundefined%
    setlength{unitlength}{565.85061095bp}%
    ifxsvgscaleundefined%
      relax%
    else%
      setlength{unitlength}{unitlength * real{svgscale}}%
    fi%
  else%
    setlength{unitlength}{svgwidth}%
  fi%
  globalletsvgwidthundefined%
  globalletsvgscaleundefined%
  makeatother%
  begin{picture}(1,0.5817873)%
    put(0,0){includegraphics[width=unitlength]{spherefig2c.pdf}}%
    put(0.34077896,0.28258916){color[rgb]{0,0,0}makebox(0,0)[lb]{smash{$r$}}}%
    put(0.58016112,0.22314528){color[rgb]{0,0,0}makebox(0,0)[lb]{smash{$y$}}}%
    put(0.02588695,0.05284654){color[rgb]{0,0,0}makebox(0,0)[lb]{smash{$x$}}}%
    put(0.26925349,0.33843429){color[rgb]{0,0,0}makebox(0,0)[lb]{smash{$theta$}}}%
    put(0.20743185,0.09461795){color[rgb]{0,0,0}makebox(0,0)[lb]{smash{$varphi$}}}%
    put(0.51123087,0.43150768){color[rgb]{0,0,0}makebox(0,0)[lb]{smash{$ {bf hat{boldsymbolvarphi}}$}}}%
    put(0.45832621,0.49970874){color[rgb]{0,0,0}makebox(0,0)[lb]{smash{${bf hat{r}}$}}}%
    put(0.47736687,0.29366584){color[rgb]{0,0,0}makebox(0,0)[lb]{smash{$ {bf hat{boldsymboltheta}}$}}}%
    put(0.18005551,0.55995116){color[rgb]{0,0,0}makebox(0,0)[lb]{smash{$z$}}}%
    put(0.25781455,0.40019168){color[rgb]{0,0,0}makebox(0,0)[lb]{smash{$(x,y,z)$}}}%
  end{picture}%
endgroup%
All that is left to do, is import this into your main latex file:
begin{figure}
    import{newfigs/}{spherefigc2.pdf_tex}
  caption{Definition of the geometric variables for an infinitesimal
    volume element $dV$ in spherical coordinates.}
  label{Sphere.figc}
end{figure}
where the end result, looks like this:
this is a low-grade snapshot of a page of our book, but if you want to see the vectorised plot, click here.
Exporting the complete figure
Some editors of journals or books may not be set up to do this dynamic handling of fonts in figures. For them, you can “export” to a pdf file with the (correct) fonts statically embedded, you can use the package standalone.cls. Note that in the code below, we tell standalone to call the fonts from the class you want (in this case, cambridge6A.cls):
documentclass[class=cambridge6A,crop=true]{standalone}
usepackage{import}
usepackage{color}
usepackage{graphicx}
usepackage{amsmath,latexsym,amsfonts}
begin{document}
  import{newfigs/}{spherefig2c.pdf_tex}
end{document}
and its output you could call in your main latex file, in the “traditional” latex way:
begin{figure}
  includegraphics{spherefig2cwithfontsembbeded.pdf}
  caption{Definition of the geometric variables for an infinitesimal
    volume element $dV$ in spherical coordinates.}
  label{Sphere.figc}
end{figure}


